The HR analytics and planning space is becoming more complicated and with many solutions at play the market is
also becoming very crowded. Yet of all the categories in the 25th Annual HR Systems Survey, this category, HR
analytics and planning, rated the lowest in terms of satisfaction. So, let’s find out why.
Please note, the following article is based on the key findings from the 25th Annual HR Systems Survey. If you’d like a quick overview of this report, watch our webinar, Refine & refresh your HR technology roadmap.
HR Analytics: Understanding the greatest gaps
Only 50% of organisations feel their primary analytics and planning application “meets their business need most of
the time” and just 11% feel it “meets all of their needs”. So why is confidence so low in these applications? Here are
the top 3 reasons:

Top factors for high UX ratings
When considering your investment in tools to support your HR analytics and planning, the following insights from the 25th HR Annual HR Systems Survey should be top of mind:
- Ease of use
- Strong reporting
- Accessible external data
- Global capabilities
A model for successful end user experience
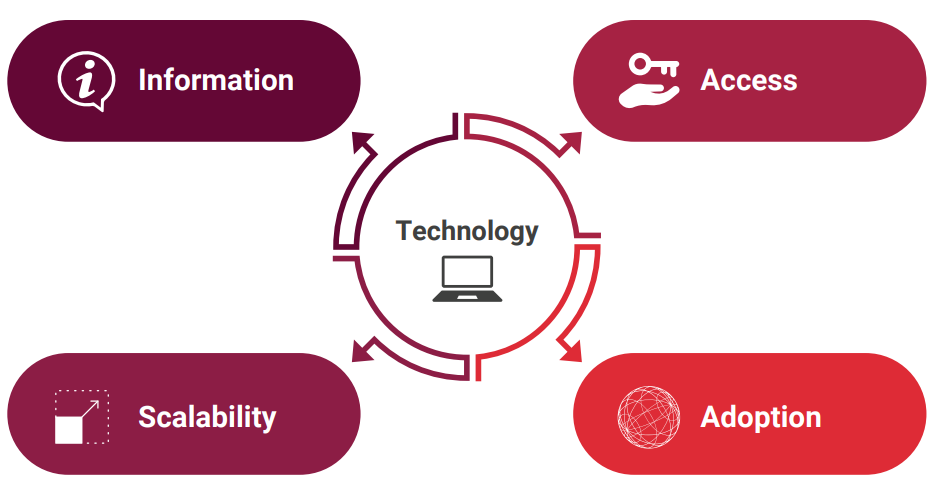
What can be done to lift the overall satisfaction with HR analytics and planning solutions so as to find the best fit for the organisation? The research supports that a more integrated approach is required. A practical model for integrating technology and the end-user experience is illustrated below:

The model’s emphasis is on thinking about each component of the model (technology, information, scalability, access and adoption) from the point of view of the end user so as to streamline their experience and expectations. By asking key questions for each component of the model from the enduser perspective, we’ve found organisations can become more aware of their choices and how these affect the end-user experience. With this understanding organisations can then move on to addressing quick-wins, modernising legacy analysis and providing an outcome-driven design to HR analytics and planning with the solution doing the heavy lifting with respect to streamlining and simplification of service and reporting delivery.
Key questions to address from the end-user perspective:
- Technology: what is the added value of the technology for the end user?
- Information: what do end users want to know and why?
- Access: what safe and secure access do end-users expect?
- Scalability: what scale is needed to support end-users?
- Adoption: what evolving expectations must we fulfill?
Want to learn more about the above components?
Download our free whitepaper to examine each component with a focus on what the end-user expects and needs.


