Project overview: moving towards automated HR reporting and org charts
A Melbourne-based federal government department with 2000 employees was looking to transform their HR processes. They wanted to move away from manual, time-consuming tasks to more strategic and automated HR reporting and org charts.
This government department has an on-prem SAP HCM system. Since data security is a high priority for them, they decided to consult our expert tech team at Navigo who took them through the entire implementation process. We offered them the on-prem version of our popular org design software, org.manager.
After a successful launch, their HR team received overwhelmingly positive feedback and had high adoption rates throughout the organisation. It was voted as their #1 internal project delivered in that year – saving the organisation hours of manual work, creating space for their HR team to focus on more high-level projects.
Read on below to learn more about their project scope, implementation process and the outcomes. Don’t feel like scrolling? Skip to watch our webinar instead!
Project requirements and scope
- Improve data quality in SAP
- Streamline data cleansing processes
- Create one portal to securely share HR data
- Easily access real-time information
- Reduce time-consuming HR reporting tasks
The solution: Not just simple org charts
Navigo offers a range of org design solutions, but they decided to go with org.manager as it closely matched their requirements. In addition to creating org charts and visualising payroll data, org.manager also provided automated HR reporting and analytics, data management, talent planning and much more.
It was a one-stop solution for all their HR needs.
The implementation process
- Create a direct connection between SAP and org.manager – We were able to replace Nakisa with org.manager and hosted it on-premise as per their requirements.
- Fully brand the environment – We used the organisation’s brand guidelines to fully customise the environment with their logo and brand colours.
- Provide access to a select group – Once the environment was ready, we gave access to a select group for initial stakeholder input. This way the organisation had complete transparency and were involved every step of the way.
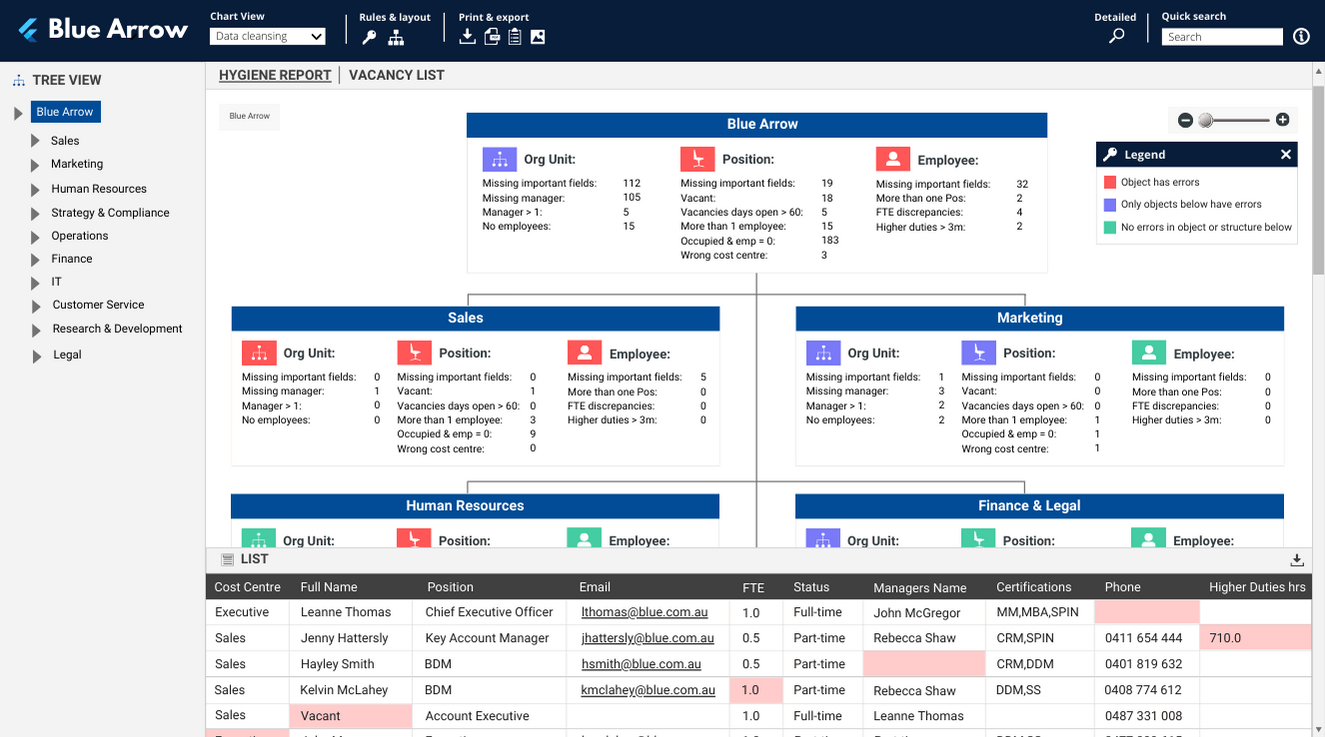
- Visualise their SAP data for the first time in a hierarchical sense – This helped to identify some key issues that were known, but had been difficult to resolve with a large workforce and without spending a lot of time analysing manual reports.
- Easily identify orphan positions – org.manager’s config automatically identified issues with positions broken in the hierarchy (creating orphans) and incomplete data.
- Quick turnaround and feedback – The initial report was quickly reviewed by key stakeholders and seamlessly updated back in SAP. This resulted in a much faster process than anticipated.
- Establish an ongoing data cleansing loop – This paved the way for an effective, ongoing data cleansing review. An example of their HR data report is shown below, this report dynamically updates as SAP data refreshes. It created a data cleansing loop and achieved consistent accuracy in SAP without having to use multiple spreadsheets.
So now that they had accuracy and importantly, confidence in the data, it resulted in a seamless go live for a general employee chart across the organisation.
- Decommission end-of-life staff directories – Resulted in a number of staff directory tools that were legacy/end of life being decommissioned.
- High adoption rate – Employees simply had to access one portal which was easy to use and it resulted in a very high adoption with thousands of logs per month.
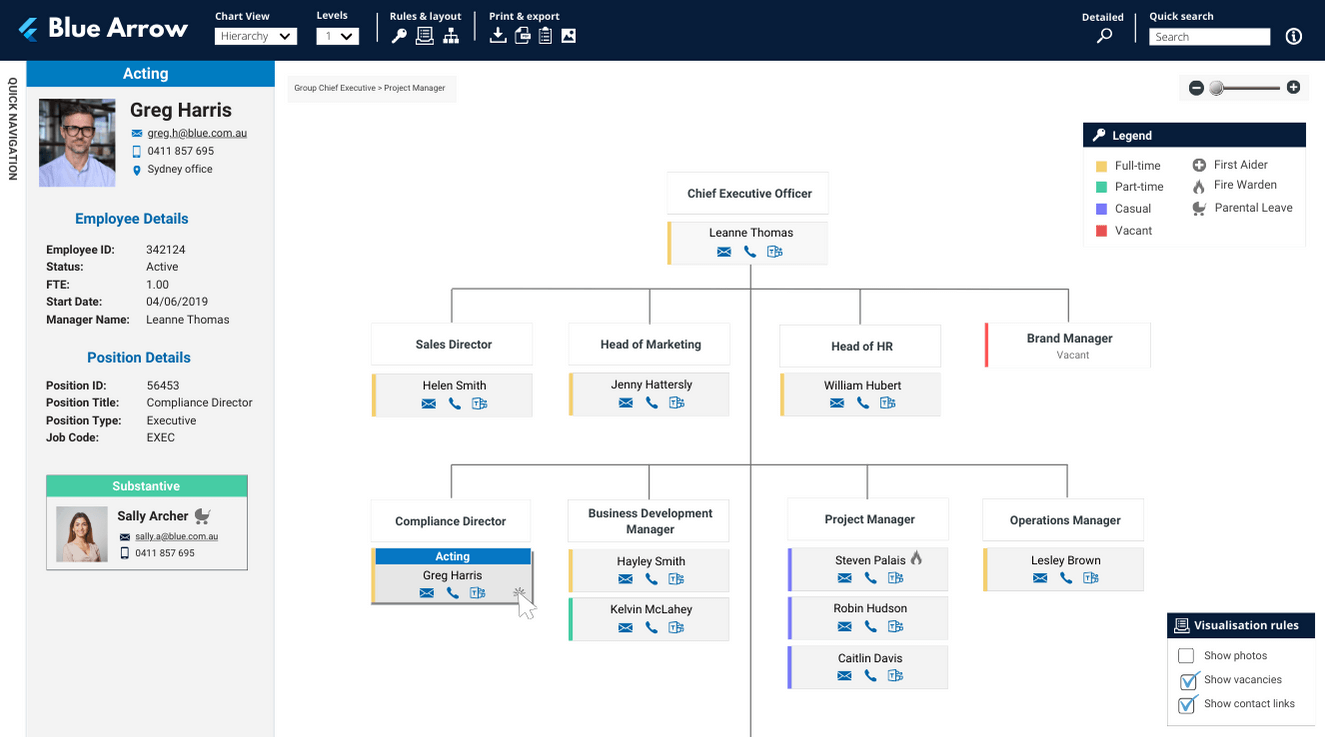
- Accurate picture of your organisation – org.manager also has the ability to handle complex business rules to visualise a dynamic workforce. Whether its higher duties, secondments, concurrent roles, acting positions and so on, it creates that highly accurate picture of where your employees are actually assigned.
Once the general chart was rolled out, we then looked to start leveraging the direct connection established with SAP – bringing the data to life.
- HR data accuracy is key – This enables organisations to be effective in their evidence-based decision making. It creates big impacts for key areas such as finance for budgeting, or org design teams for workforce insights and updates.
- Highlight problem areas – Simple but effective concepts such as conditional highlighting and visualisation rules to easily identify key areas of focus were configured.
- Save hours of manual work – Stop managers spending time on low level tasks in creating manual reports, transferring that time to the actual analysis of the data instead.
- Separate org charts for each key metric – We built various views that included key HR metrics such as employment status, FTE, headcount, span of control, tenure, and diversity.
5. Dashboard reporting
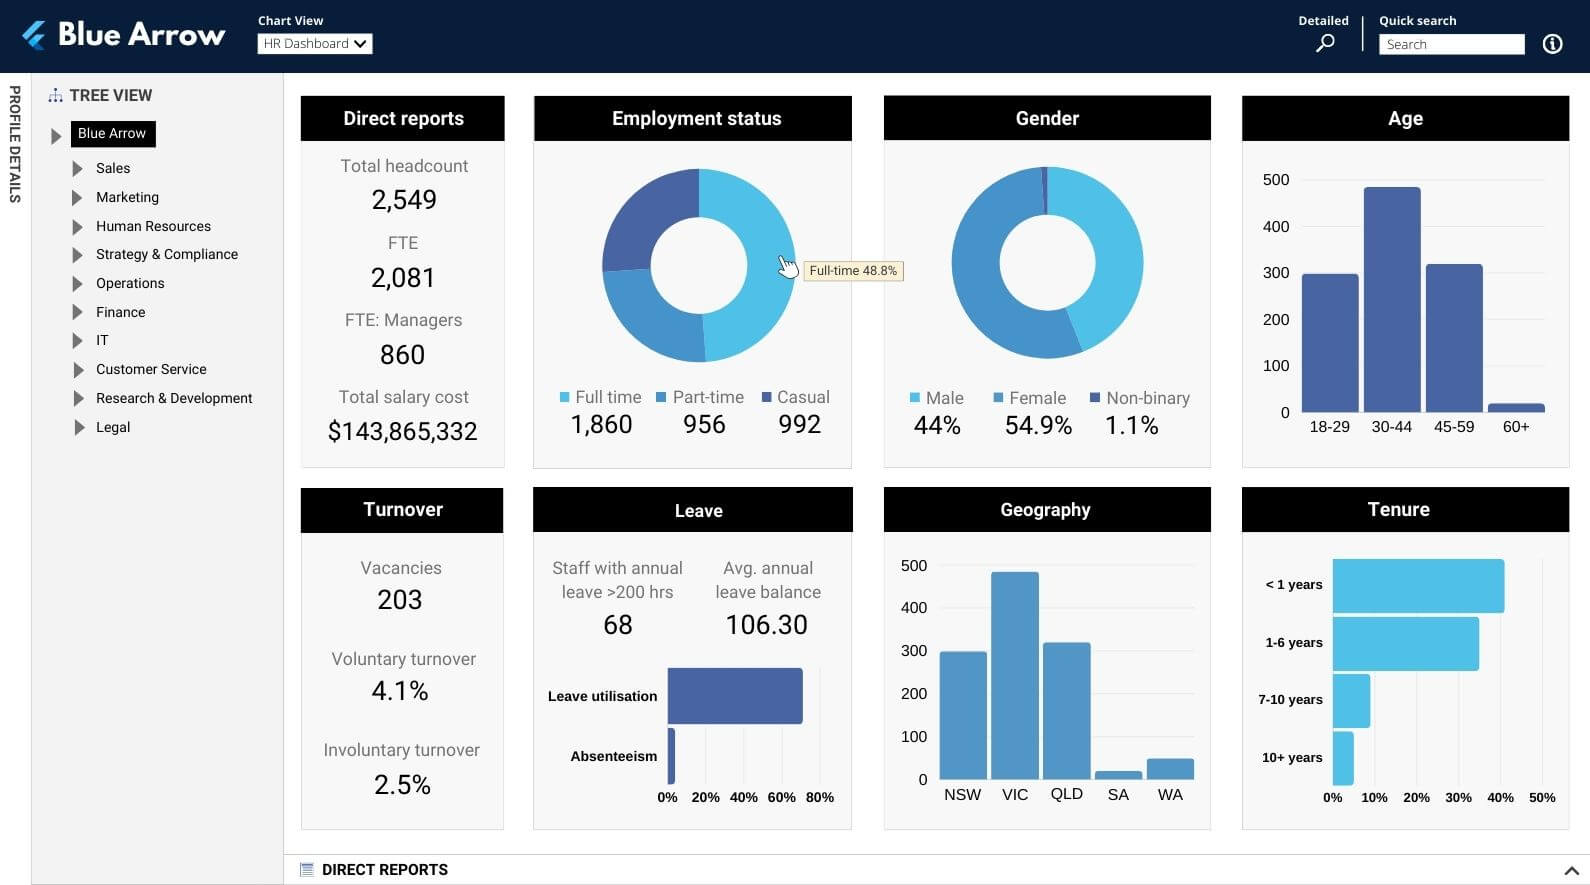
The next step was to transform these hierarchical views into dashboard reporting.
- Visualise complex data sets in a simple manner – It was key for executive engagement and insights and collating a large set of complex data into one visual.
- Make data-informed decisions – Use in monthly executive meetings, transformed how the business analysed key HR metrics and ultimately led to better informed decision making processes.
- Save a lot of effort from IT teams – This replaced previous Power BI reporting which saved a huge amount of time in development for their IT teams.
Our expert tech team will do all the heavy lifting for you so you have the most seamless implementation from start to finish. With our proven track record of over 200 successful implementations in the past 5 years, our customers don’t need to worry about a thing.
Learn more about our amazing customer success and implementation team.
Outcomes and big wins
What was different for the organisation once org.manager was fully implemented?
- Automated org charts and reporting
- Accurate SAP data, ongoing effective data cleansing processes
- Management self-serve
- Confidence in the data and great end-user satisfaction
- We made HR look awesome!
Wait! There’s more
Watch our full webinar featuring resident org design experts, Andrew and Michelle, to get a better understanding of the project’s implementation process:


